

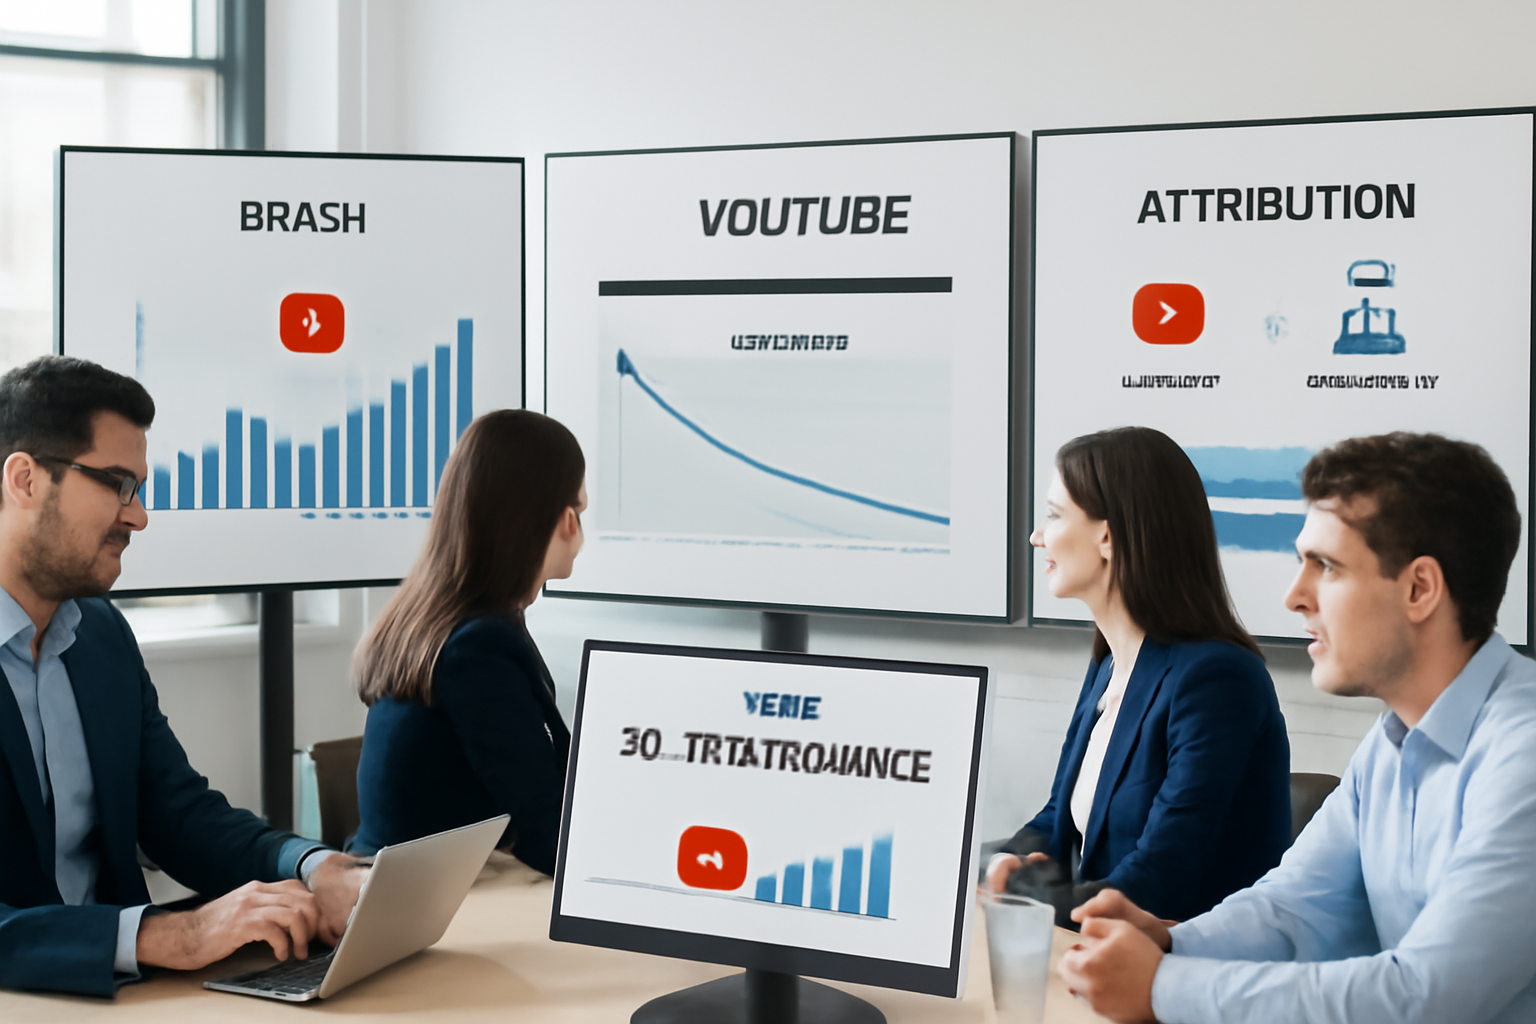
YouTube ad metrics update 2026: A practical marketer’s playbook
YouTube’s 2026 ad metrics update reshapes how brands measure performance and attribute value across video placements, Shorts, and in-stream formats. This playbook translates the changes into clear interpretations and step-by-step actions for businesses, startups, eCommerce companies, service providers, B2B marketers, and agencies.
What changed — quick overview
The platform’s recent update focuses on three practical areas:
- Richer breakdowns of reach, viewability and audience retention across formats (including Shorts).
- Improved conversion and incrementality measurement with better experiment support and attribution windows.
- Deeper creative-level insights and exportable metrics to support cross-channel reporting.
Below we unpack each change and give clear recommendations on interpretation and optimization.
Updated metrics: what to expect and how to read them
1. Reach & overlap metrics
What it shows: Expanded reach reporting now highlights unique users reached by format and indicates overlap with other YouTube placements (e.g., Shorts vs. long-form).
How to interpret: High overlap suggests audience saturation; strong unique reach indicates true incremental exposure.
Optimization action: Stagger creative and frequency across placements. If overlap is high, move budget to formats with stronger unique reach or test different creatives to reduce ad fatigue.
2. Viewability and watch-depth
What it shows: More granular viewability (viewable impressions) and watch-depth segments (e.g., 25%, 50%, 75%, complete).
How to interpret: Watch-depth is a proxy for engagement and message delivery. High viewability with low watch-depth points to weak creative starts.
Optimization action: For low watch-depth, refine your first 3–5 seconds. Test teasers, clearer hooks, or on-screen captions to improve attention.
3. Creative-level retention curves
What it shows: Retention graphs for individual ad variants and timestamps where drop-off occurs.
How to interpret: Identify exact moments where viewers leave—bad pacing, unclear value proposition, or a long intro are common culprits.
Optimization action: Trim or re-edit problem segments, A/B test alternate opening frames, or rework call-to-action timing to later in the spot if early drop-off is unavoidable.
4. Shorts and vertical-specific KPIs
What it shows: Separate metrics for Shorts performance, including loop counts, completion rate, and swipe/engagement signals.
How to interpret: Shorts behave like social content — fast hooks and loopability matter more than traditional view metrics.
Optimization action: Create vertical-first creative with loop-friendly endings and visual cues to encourage rewatching or clicks.
5. Conversion attribution & incrementality support
What it shows: New experiment tools and clearer attribution windows help isolate the lift from YouTube ads versus other channels.
How to interpret: Use experimental results to validate whether actions are incremental rather than merely reassigning conversions that would have happened anyway.
Optimization action: Run holdout or geographically split tests for major campaigns. If lift is small, adjust audience targeting or creative; if lift is strong, scale gradually while maintaining test controls.
Optimization playbook: creatives, bidding, targeting
Creatives
- Start strong: First 3 seconds should contain your hook and brand cue.
- Format-fit: Produce separate cuts for Shorts, in-stream skippable, and non-skippable placements.
- Retention-driven edits: Use retention curves to make surgical edits—cut or replace low-performing moments.
Bidding
- Align objective and metric: Bid for conversions or viewable CPM depending on whether your primary goal is direct action or mass awareness.
- Use layered bidding: For tests, run both view-based and conversion-based bidding to see which optimizes better for your funnel stage.
Targeting
- Reduce overlap: Use the new reach overlap data to minimize wasted impressions across placements.
- Audience sequencing: Serve different creative messages by user stage—awareness, consideration, conversion—using sequential targeting.
Cross-channel attribution tips
- Combine experiments with modeled attribution: Use YouTube’s experiments for causal lift alongside your multi-touch model to reconcile differences.
- Align windows: Make sure attribution windows across channels match when comparing results (e.g., 7-day click vs 28-day view).
- Layer analytics: Export YouTube metrics into your analytics warehouse for side-by-side comparisons with social and search performance.
Ready-to-use reporting templates (KPIs by use case)
Agencies
- Primary: Unique reach, overlap rate, cost per unique reach, incremental lift (experiment), client ROAS.
- Secondary: Creative retention by variant, viewable CPM, completion rate by format.
eCommerce brands
- Primary: Conversions (attributed & experiment lift), CPA, purchase ROAS, add-to-cart lift.
- Secondary: View-to-cart rate, watch-depth on product demos, Shorts engagement for product discovery.
Startups & B2B marketers
- Primary: Lead conversions, cost per lead, incremental lift from experiments, accounted view-to-lead funnel.
- Secondary: Retention on educational creatives, impressions-to-demo request rate, cross-channel assisted conversions.
Practical examples
Example 1 — eCommerce: A direct-to-consumer brand sees strong reach but poor conversion. Using retention curves they find a weak product reveal at 7s. After re-editing to reveal earlier and running a holdout test, conversions per exposed user increase.
Example 2 — B2B: A software startup tests two audience strategies. Experimentation shows a higher incremental lift from a targeted intent audience despite lower raw impressions, prompting budget reallocation toward intent signals.
FAQs
Do I need to re-track conversions after this update?
Not necessarily, but verify your conversion windows and import settings. Use experiments to validate whether observed changes reflect real incremental performance.
Will Shorts metrics change how I budget?
Yes—Shorts often deliver high engagement but different downstream behaviors. Treat Shorts as a discovery channel and set separate KPIs and budgets accordingly.
How long should I run experiments to measure incremental lift?
Run experiments long enough to reach statistical confidence for your conversion volume—commonly several weeks, but this varies by traffic and conversion frequency.
Conclusion
The 2026 YouTube ad metrics update gives marketers more precise tools to measure reach, engagement, and incrementality. Use retention curves, format-specific KPIs, and experiments to move from vanity metrics to action-driven measurement. Test creatively, align attribution windows across channels, and let experiment results guide scale decisions.
Call to action
Need help translating these metrics into a working media plan or custom reporting for clients? The Next Zeros specializes in performance-driven video strategies and measurement. Contact us to build experiments, optimize creatives, and set up cross-channel reporting that drives measurable growth.
FAQs (Short)
Q: Is this update relevant to small budgets? A: Yes—improved attribution and creative signals help optimize spend regardless of scale. Q: Should I stop using view-based metrics? A: No—pair them with conversion and incrementality testing for a fuller picture.